A Step-by-Step Guide to Effective Primary Data Collection for Academic Research in India
Academic research is only as strong as the data it relies upon. For researchers, the quality of primary data directly influences the credibility of findings and the likelihood of publication in peer-reviewed journals.
In India, collecting reliable primary data is often challenging due to limited access to representative samples, regional diversity, and time or budget constraints. These issues can delay research and affect data validity.
In academic research, primary data collection involves gathering original, first-hand data through surveys, interviews, focus groups, or experiments, tailored to India’s demographic and regional context.
This step-by-step guide is designed for PhD scholars, faculty members, postdoctoral researchers, and postgraduate students in India who need dependable primary data for theses, journal publications, and academic research.
Not sure how to approach primary data collection for your study?
Discuss your research objectives, sampling strategy, and methodology before finalising your approach.
Before thinking about methods or participants, ask yourself:
What exactly am I trying to study?
What is my primary research question or hypothesis?
Do I want to explore new patterns (exploratory research/qualitative primary data collection) or test a hypothesis (confirmatory research/quantitative primary data collection)?
Research Tip: Strong objectives act as a compass. A vague aim (“I want to study consumer behaviour”) will lead to vague data. A clear aim (“I want to study how rural Indian old-age citizens perceive digital payments”) ensures your survey is focused and actionable.
Step 2: Choose the Right Sampling Method
Your findings are only credible if your sample truly reflects the population you’re studying.
Random Sampling: Every participant has an equal chance of being selected for the study. It’s one of the most widely used sampling methods for primary data collection because it reduces bias and ensures the sample is more representative of the larger population.
Quota Sampling: Ensures diversity (e.g., equal numbers from Tier 1, 2, 3 cities; students vs. professionals). Very useful in academic surveys. This team of researchers at Calcutta University collected equal number of responses from 4 regions of India while collecting primary data for research.
Stratified Sampling: Break the population into subgroups and samples proportionately. E.g. – if you are studying college students in India – divide them into strata like undergraduate vs postgraduate / male vs female / urban vs rural. Randomly selection individuals from each strata – if there are 70% male students & 30% female students in India, your sampling selection should proportionately have those many numbers. This ensures representation of minority groups that might be missed in random sampling.
Convenience Sampling: Easy to implement (friends, colleagues), but high risk of bias. Many researchers rely heavily on convenience sampling due to resource limits, which hurts the credibility of findings. To make your study publication-ready, ensure representation across demographics.
Step 3: Design a High-Quality Questionnaire
Good questionnaire = reliable data. Before starting data collection in research, take feedback from your peers, supervisors and even friends and colleagues on how do they perceive your questionnaire. For an effective primary data collection, here’s what to keep in mind:
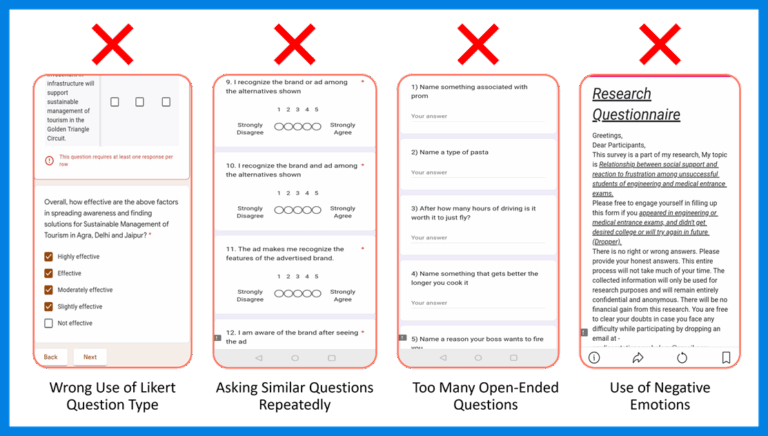
Clarity of Language: Avoid jargons. Write in simple English or local languages. Repeating same question by just rearranging the words and language – makes questionnaire lengthy, participants lose interest, increase drop-outs.
Avoid Leading Questions: Don’t nudge participants (“Do you agree plant-based diets are healthier?”). Instead, ask neutrally (“What is your opinion on plant-based diets?”).
Balance Question Types: Mix closed-ended (Likert scales, multiple-choice) with open-ended questions to capture both statistics and insights. Too many open-ended questions – users may end up writing random answers or may type NA.
Test the Flow: Move from general to specific. Best practice is to keep demographics at last. Avoid too many reverse coded questions – confuses participants, may answer vaguely or unclear insights.
Avoid being too personal: Asking too much about personal failures or life setbacks in the survey – participants may drop-out, give falsified answers or even give negative feedback about the whole study.
Expert Tip: To make sure your primary data collected is flawless and depicts academic rigor, avoid these common mistakes while creating questionnaire (as shown below)
Step 4: Ensure Ethics and Consent
Ethical primary data collection builds trust and credibility.
Always inform participants about the purpose of the study, and the risks involved (if any).
Collect informed consent — digital or written.
Maintain confidentiality — never reveal personal identifiers without permission.
For sensitive topics (e.g., health, finance), ensure anonymity in reporting.
Best Practice: Choose total anonymity in your study. This keeps you away from the head-ache of storing data and maintaining security. More importantly, the freer and more anonymous the participants feel while answering the research, the better chances you have of obtaining quality answers. And you will see less drop-outs.
Step 5: Choose the Right Data Collection Methodology
Depending on your resources and objectives, you can select:
Focus Groups: A qualitative research method where a small group of people (usually 6–10 participants) are brought together to discuss a specific topic, product, idea, or service under the guidance of a trained moderator. It’s used to gather in-depth insights into people’s opinions, perceptions, motivations, and experiences that surveys or quantitative methods might miss.
In-depth-interviews: Another qualitative mode of primary data collection, it involved one-on-one conversation between a researcher (interviewer) and a participant (respondent). They’re semi-structured or unstructured, meaning the interviewer has a discussion guide but can probe deeper. The goal is to explore personal experiences, beliefs, motivations, and perceptions in detail.
Face-to-Face Surveys: Done personally (e.g. at a mall), highly engaging, but time-intensive. They are structured in nature, usually a fixed questionnaire with mostly close-ended questions (e.g., multiple choice, rating scales). Goal is to collect quantitative data that can be measured, compared, and statistically analysed. The interviewer sticks to the script, minimal probing.
Online Panels: Fast, scalable, and diverse; especially powerful for nationwide studies. The respondents can answer the surveys online from any device of their choice (mobile/tablet/laptop/desktop); at their choice of time and convenience. Increases quality of responses and in turn increases chances of getting them published. Read how this research team from IIM Kozhikode enhanced their data collection process using online panels.
Telephone Surveys: A telephonic interview is a qualitative data collection method where researchers interact with participants over the phone instead of face-to-face. It’s a structured or semi-structured conversation designed to gather insights, opinions, or experiences related to a research study. Good for reaching rural areas or niche audiences.
Challenge in India: Many PhD students struggle to get responses beyond their college network. Online platforms solve this by providing access to pre-screened participants across India. Read this guide on best practices to follow before starting data collection for research.
Finding it difficult to reach the right respondents for your study?
From precise demographics to nationwide coverage, ThinkSurvey helps academic researchers overcome sampling, reach, and data reliability challenges.
Never launch a full survey without testing it. A pilot run with 20–30 participants can reveal:
Confusing questions
Technical issues in online forms
Time taken to complete the survey
Early trends that may refine your research design
ThinkSurvey Tip:We encourage academic researchers to run a pilot with at least 5–10% of their planned sample size. Your network, peers and students at college could be the fastest and cheapest way to test your questionnaire initially, before launching the survey for bigger primary data collection.
Step 7: Clean, Analyse, and Interpret Data
After completing data collection, raw data is never ready for use. You must:
Remove incomplete or duplicate responses.
Code open-ended answers into themes (thematic analysis).
Use statistical tools (SPSS, R, Excel) to test hypotheses.
Compare subgroup results (e.g., male vs female, urban vs rural).
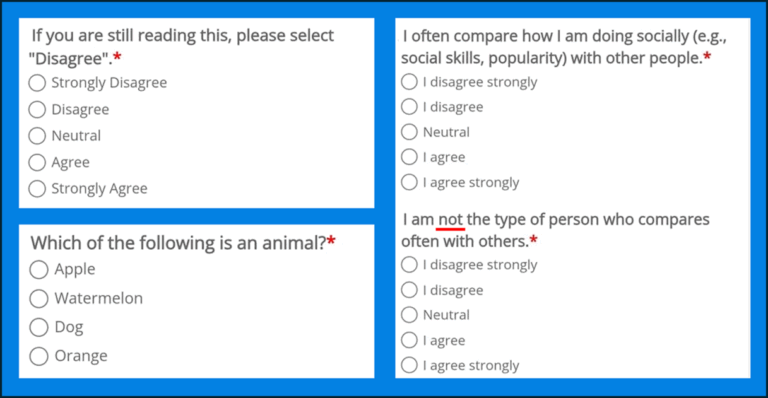
Research Tip: Journals often ask for a methodology section explaining your cleaning and analysis process. Add validation checks in your survey design, include attention-check questions to filter out careless responses. Remove “straight-lining” responses (same answer for every item). Keeping all this well-documented strengthens your paper and authenticates your primary data collection process. Below are some commonly used attention checks.
Step 8: Present Findings in a Publication-Ready Format
Use tables and charts (bar, pie, heatmaps) for clarity.
Always link findings back to your original research questions.
Pro Tip: Visuals (infographics, thematic word clouds) make your findings digestible and attractive for wider audiences. By default, they not only explain your data collection process & efforts to academia, but audiences beyond that as well.
How ThinkSurvey Supports Academic Data Collection in India
At ThinkSurvey for academic research, we’ve partnered with dozens of PhD scholars and faculty across India to make their projects a success through online mode of primary data collection. Here’s what we bring:
Diverse Audience Panel: Pre-screened participants from Tier 1, 2, and 3 cities.
Balanced Demographics: Age, gender, income, education, and profession-based targeting.
Scalable Projects: From 100 responses for a pilot to 10,000+ for national studies.
Expert Guidance: Hand holding at every step of data collection.
Timely Delivery: Quick turnaround to meet academic submission deadlines.
With the right design and execution, your research can be more than a requirement — it can contribute to knowledge, influence policy, and strengthen your academic journey.
Ready to strengthen your research with high-quality primary data?
Whether your study involves surveys or interviews, ThinkSurvey enables reliable data collection across India.
Primary Data Collection in India: Step-by-Step Summary:
Define clear research objectives
Choose an appropriate sampling method
Design a bias-free questionnaire
Ensure ethics and informed consent
Select the right data collection methodology
Pilot your study
Clean and analyse data
Present findings in a publication-ready format
Frequently Asked Questions (FAQs)
1. What is primary data collection in academic research?
Primary data collection refers to gathering original data directly from respondents (citizens of a country) using methods like surveys, interviews, focus groups, experiments, or observations. In India, these are vital for thesis validation, journal papers, and conference submissions.
2. Why is primary data collection important in the Indian academic context?
Primary data offers contextual accuracy and relevance – especially in diverse markets like India, where behaviours, norms, and socio-economic strata vary significantly across Tier-1 to Tier-3 cities. Universities appreciate localized primary data to validate hypotheses and contribute credible insights to global journals.
3. Why is primary data collection often considered more expensive than secondary methods?
Collecting fresh data requires rigorous sample screening, incentives, survey design, and data validation – unlike using existing datasets. But in academic research, this investment pays off by improving the credibility, statistical rigor, and originality of findings. Like this paper on role of social media in spreading fake news, by the research team at IIM Kozhikode, got published in a leading journal.
4. What are the main methods of primary data collection used in Indian academic studies?
Common approaches include:
Surveys and questionnaires – scalable and cost-effective for large groups.
Interviews and focus groups – deep, qualitative insights for behavioural studies.
Experiments and observations – controlled methods for cause-effect research.
CAPI / CAPIi (tablet-assisted in-person interviews) – used for complex or locality-specific research.
5. How is primary data collected efficiently across India?
Using structured online survey platforms with stratified sampling, mobile-friendly surveying, screening filters, and real-time tracking can ensure both speed and quality. Platforms like ThinkSurvey offer panels across more than 108 cities, representing urban, semi-urban, and rural demographics of India.
6. Which primary data collection method works best for academic needs?
Depends on research objectives. For behavioural or large-scale quantitative studies, online surveys with robust sampling are ideal. For depth and nuance, interviews or focus groups work better. Hybrid methods (e.g. survey plus in-depth follow-up interviews) often yield the best of both worlds. Live example of mixed-method studies could be this one on millet-based food market research.
7. When is primary data collection preferred over secondary data for academic work?
When the research question is context-specific, current, or longitudinal, or if existing data lacks Indian-market relevance (e.g. behavioural studies, trend tracking, qualitative explorations). That’s when tailoring your own primary data yields original insights and publication value.